The Effects of the Supplemental Nutritional Assistance Program on Nutrient Demand – Evidence from The National Food Acquisition and Purchase Survey (FoodAPS)
The Supplemental Nutrition Assistance Program (SNAP) is a federal program that provides food assistance to low-income individuals and families. This study examines the impact of SNAP benefits on the diversity and quality of participants' diets using data from the National Food Acquisition and Purchase Survey (FoodAPS)1. Our findings suggest that SNAP benefits moderately increase the diversity and quality of participants' diets but still contribute to unhealthy overconsumption of calories. Furthermore, we show that monetary costs only partially account for Americans' demand for unhealthy food. We estimate the marginal propensity to consume 21 different nutrients. Based on the estimates, increases in transfer payments are only likely to result in marginal impacts on systemic diet-related health issues, including obesity, type 2 diabetes, heart disease, stroke, and certain cancers. Future avenues for research include evaluating other solutions for increasing the consumption of healthy food, improving estimates of the effects of transfer payments on nutrition through food log data, and exploiting the geographic variability in SNAP administration through restricted access to FoodAPS.
Introduction & Motivation
Since the Great Depression, the United States Federal Government has played an ever-increasing role in providing basic nutrition for low-income households. For most of the 20th century, the main policy goal was anti-hunger, leading to the creation of many food welfare programs, including the Food Stamp Program (FSP), the Special Supplemental Nutrition Program for Women, Infants, and Children (WIC), and The National School Lunch Program (Mozaffarian, Fleischhacker, and Andrés 2021). These programs are run with federal funding and are overseen by the United States Department of Agriculture (USDA). In 2008, The Supplemental Nutritional Assistance Program2 (SNAP) was introduced as part of the Food and Nutrition Act as a successor to the Food Stamp Program in an effort to destigmatize uptake. However, the obesity epidemic shifted the goals of many food assistance programs from anti-hunger to a broader focus on nutrition security. In the 2021 Thrifty Food Plan, the USDA explicitly cites improving nutrition insecurity and its resulting negative health consequences as one of its key objectives (Thrifty Food Plan, 2021). This paper uses food purchase and acquisition data collected by the USDA to assess the effects of SNAP on the nutrient consumption patterns of households participating in the program.
The World Health Organization defines obesity as a body mass index (BMI) greater than 30. In 1976-1980 the prevalence of obesity amongst American adults was 15%, but since the 1980s, obesity rates have continually increased (Temple 2022). Between 2017 and March 2020, the prevalence of obesity amongst American adults was 41.9%3. Obesity has large associated economic costs in the form of increased healthcare costs. Obesity is related to chronic diseases like type 2 diabetes, heart disease, stroke, and multiple cancers. Furthermore, these costs are unequally distributed along ethnic and racial lines. NHANES data collected from 2019 shows that non-Hispanic black adults experience the highest rates of obesity (38.4%), followed by Hispanic adults (32.6%) and non-Hispanic white adults (28.6%) (Petersen 2019). Due to these chronic diseases, obesity increases healthcare costs and lowers productivity. The estimated medical cost of obesity in 2008 was 147 billion dollars, equating to an increase of 1,429 dollars annually for a person with obesity (Petersen 2019).
An abundance of evidence shows that the obesity epidemic has been incredibly costly to Americans in the form of shorter lives of lower quality. Obesity is caused by chronic overconsumption of calories. In theory, diet composition should not affect obesity because only the quantity of food matters. However, evidence shows that foods with poor nutritional qualities, like ultra-processed foods and sugar-sweetened beverages, are closely linked with both the rise and incidence of obesity (Temple 2022). Furthermore, individuals with poor nutrition are at higher risk for developing obesity, type 2 diabetes, hypertension, stroke, and cancer, even when adjusting for risks like age, sex, employment, income, and education (Mozaffarian, Fleischhacker, and Andrés 2021). The link between nutritional quality and systemic health issues provides essential motivation for improving nutrition in the USA. The next step is to determine why nutrition gaps exist and how they can be closed.
Like any good, the availability and acquisition of healthy food is a function of supply and demand. Many have linked poor nutrition to a lack of available supply of healthy food. The primary mechanism for supply issues is hypothesized to be food deserts, areas with low access to healthy foods. Indeed, people living in food deserts are more likely to be obese, less educated, poorer, and black or Hispanic; however, it is easy to mistake correlation for causation. A decade of causal research has concluded that there is little to no evidence that food deserts have meaningful causal impacts on health and nutritional disparities (Zhen 2021).
This conclusion implies that the poor nutrition of communities living in food deserts is an issue of food choice, not food availability. If markets for healthy food are working efficiently, then healthy food suppliers will set up shops where their products are demanded. Therefore, there are only two explanations for a lack of supply for healthy food: 1) insufficient demand for healthy food, or 2) some market failure preventing suppliers from providing goods where they are demanded. Without evidence of market failures, the household demand for healthy foods and nutrients must be assessed.
Household demand for food is a function of available foods and their associated costs. The pricing element of demand motivates government transfers to address poor nutrition. If healthy food is a normal good, then an increase in household income due to SNAP benefits should also increase the nutritional quality of a household’s diet. This paper assesses the impact of SNAP benefits on a household’s nutrient demand. Rich data from the USDA allows for estimating the marginal propensity to consume (MPC) of a particular nutrient for an additional dollar of SNAP benefits.
Literature Review
Determining any causal outcome from SNAP participation faces endogeneity in the form of self-selection. It is impossible to observe the counterfactual – the food choices of a family on SNAP if they weren’t part of the program. Systematic reviews find that SNAP effectively reduces hunger and food insecurity, but its impacts on nutrition remain difficult to quantify (Andreyeva, Tripp, and Schwartz 2015). Most studies do not assess the causal impact of SNAP on nutrition and instead rely on descriptive analysis. There remain a handful of studies that evaluate SNAP’s effects on nutrition. The variable of interest is the MPC for a particular nutrient. For example, the MPC of protein is the additional grams consumed for a one-dollar increase in income. Most studies assessing SNAP’s impact on nutrition fall broadly into two categories 1) dataset restrictions or 2) exploiting geographic variability in policy using either fixed effects or instrumental variables.
Dataset restriction approaches limit the sample to SNAP-eligible households or households within a certain range of eligibility. Under this approach, SNAP-eligible non-participants serve as a counterfactual for SNAP participants. Due to program self-selection, this approach may overstate or understate the outcomes of SNAP because participation may depend on the initial status of nutritional security. Evidence suggests that SNAP participants may start off with worse nutrition outcomes than eligible non-participants (Ratcliffe, McKernan, and Zhang 2011). Descriptive analysis reveals that SNAP recipients are in worse health and have worse diets than both the general population and SNAP-eligible non-participants (Bitler 2014). In this case, the nutritional effects due to SNAP are likely understated. Devaney and Moffitt 1991 found that the Food Stamp Program substantially increased the consumption of calories and nutrients across the board. Gregory et al. 2013 also found that consumption increases with benefits based on an instrumental variable approach exploiting the geographic variation in the National Health and Nutrition Examination Survey (NHANES). Despite broad evidence showing increases in consumption and a reduction in food insecurity, quantifying the impacts of SNAP on overall dietary quality remain difficult.
A related literature estimates the effects of income on nutrient demand using household scanner data. It was found that households demand healthier nutrition as income increases(Allcott et al. 2018). Furthermore, counterfactual analysis reveals that if Americans faced the food choices and prices of France or Great Britain, diet quality would increase (Dubois, Griffith, and Nevo 2014). These studies provide a useful methodology that may be used in future research to refine estimates of SNAP’s effects on nutrition, given the appropriate data.
Methodology
This paper closely follows the methodology developed by Devaney and Moffitt 1991.
The Model
The demand for nutrition can be estimated using a restricted dataset and OLS methods. Equation (1) models a household’s utility function.
$$U\left( Q_{1},Q_{2},\ \ldots,\ Q_{j},C \right)$$
( 1 )
The household chooses between $j = \ 1,\ \ldots,\ J$ foods and a composite nonfood good $C$. The household’s total income is the total cash income $Y,\ $and the total SNAP benefit $B.$ The price of a given food relative to the price of $C$ is represented by $P_{j}$. Therefore, households will optimize under the constraint modeled by equation (2).
$$Y + B = \ \sum_{j = 1}^{J}{P_{j}Q_{j} + C}$$
( 2 )
Given the household utility function and budget constraint, the quantity demand for the food $Q_{j}$ is a function of prices, cash income, and SNAP benefits. Equation (3) models $Q_{j}$.
$$Q_{j} = f_{j}\left( P_{1},\ P_{2},\ ..,\ P_{j},\ Y,B \right)$$
( 3 )
To include nutrients in this model, assume that there are $K$ different nutrients being evaluated. Let $N_{1},N_{2},\ldots,\ N_{K}$ represent the total quantity demanded of a given nutrient. Let each unit of food good $Q_{j}$ yield $\alpha_{kj}$ of nutrient $N_{k}$. Therefore, equation (4) represents the total quantity consumed for a nutrient $N_{k}$.
$$N_{k} = \sum_{j = 1}^{J}\alpha_{kj}Q_{j}$$
( 4 )
$\ $The $K$ different nutrient equations constitute a true model of nutrient demand. By introducing total income $Y$, and SNAP benefits $B$ into the equation separately, it is possible to quantify the income effects for these food goods. There remain issues of model specification bias. It is difficult to disentangle the effects of $Y$ and $B$ on nutrient demand. Therefore, any identification of effects remains partial but may still be useful. The solution is to substitute the demand equations into the nutrient equations resulting in a reduced form nutrient equation, shown in equation (5).
$$N_{k} = g_{k}(P_{1},P_{2},\ldots,\ P_{j},\ Y,\ B)$$
( 5 )
A further assumption of constant price levels is applied based on the cross-sectional nature of the data. Equation (6) shows the linear equation for a given nutrient and household.
$$N_{ki} = \alpha_{k} + \beta_{k}Y_{i} + \delta_{k}B_{i} + X_{i}\phi_{k} + \varepsilon_{ki}$$
( 6 )
Here $i$ is the household, $Y_{i}$ is household cash income, $B_{i}$ is the household SNAP benefit, and $X_{i}$ represents exogenous characteristics that may affect nutrient demand. Exogenous variables like school breakfast participation, WIC participation, female head of household, black household, Hispanic household, geographic region (Northeast, Midwest, South, or West), number of meals with guests present, and urbanicity affect nutrient demand. The coefficients, $\alpha_{k},\ \beta_{k},\delta_{k},\phi_{k}$ can be estimated using OLS.
Model Estimation
Nutrient quantity by household can be obtained by summing up the nutritional composition of all food purchased or acquired for at-home consumption. However, summarizing nutrition by household does not account for the size and composition of the household. For example, a household of size four with four adult males will have vastly different nutritional needs than a household with one adult male, one adult female, and two nine-year-old boys. To account for household composition, the concept of Adult Male Equivalents (AME) can be used. AME standardizes the size of a household by total energy expenditure (TEE). A person’s TEE is the amount of energy a person is predicted to use in one day based on age, sex, and weight. AME takes various TEE measures and standardizes them to the average TEE for an adult male. An adult male will have an AME of one, and other demographics will have AME measures between zero and one. Table 1 details equations that can be used to estimate TEE for children and adults (Schofield 1985; WHO 2005). $N_{ki}$ is divided by the total AMEs of a household to create the response variable.
$$AME_{i} = \frac{TEE_{i}}{TEE_{AdultMale}}$$
( 7 )
After adjusting for household size and composition, the MPC for the following nutrients is estimated, energy (kCal), carbohydrates (g), dietary fiber (g), total sugar (g), total fat (g), saturated fat (g), monounsaturated fat (g), polyunsaturated fat (g), protein (g), cholesterol (mg), sodium (mg), vitamin A (mcg), vitamin B6 (mg), vitamin B12 (mcg), vitamin C (mg), iron (mg), thiamin (mg), riboflavin (mg), calcium (mg), phosphorus (mg), and magnesium (mg). Controls are included for school breakfast participation, WIC participation, female head of household, black household, Hispanic households, region (Northeast, Midwest, South, or West), number of meals with guests present, and urbanicity.
| Table 1 - Energy Requirement Calculations | ||
|---|---|---|
| Age Group | Sex | TEE Equation (MJ/24hr) |
| 1-18 | Male | $$1.298 + 0.265kg - 0.0011kg^{2}$$ |
| 1-18 | Female | $$1.102 + 0.273kg - 0.0019kg^{2}$$ |
| 18-30 | Male | $$2.896 + 0.063kg$$ |
| 18-30 | Female | $$2.036 + \ 0.062kg$$ |
| 30-60 | Male | $$3.653 + 0.048kg$$ |
| 30-60 | Female | $$3.538 + 0.034kg$$ |
| 60+ | Male | $$2.459 + 0.049kg$$ |
| 60+ | Female | $$2.755 + 0.038kg$$ |
Dataset Restrictions
This paper estimates the MPC under three separate dataset restrictions:
-
SNAP households and eligible non-participating households
-
SNAP households, eligible non-participating households, and non-eligible households under 185% of the poverty guideline
-
SNAP households and non-eligible households under 185% of the poverty guideline
The first dataset restriction only considers SNAP-eligible households, but these estimates may suffer from endogeneity in the form of self-selection. Eligible non-participants may have better nutrition than participants leading to an underestimation of SNAP’s effects. The second restriction seeks to alleviate this problem by adding non-eligible households near the cut-off for eligibility. The income cut-off for SNAP eligibility is at least 130% of the federal poverty guideline, but requirements vary by state. These households may want to take SNAP benefits but are ineligible, but their proximity in income provides a useful comparison point for isolating the impacts of SNAP. 185% of the poverty guideline was chosen because it is one of the target groups sampled by the USDA, and papers following a similar approach typically use a range between 130-200% of the poverty guideline. This makes 185% a natural choice for the restriction. The third restriction follows the same logic but leaves out eligible non-participants in an attempt to further resolve endogeneity due to self-selection.
Regression Design
To ensure the statistical validity of results, explanatory variables are adjusted by AME, heteroskedasticity robust standard errors are used, and the significance for each regression is Bonferroni corrected by the number of nutrients evaluated to control the experiment-wise error rate (EER). First, cash income and SNAP benefits are adjusted by the total AME of a household to account for household size and composition. Second, robust standard errors drop the requirement that the variance of residuals must be independent of the outcome. Robust standard errors are generally larger than their non-robust counterparts, but when robust standard errors are used, the error rate of t-tests is much closer to the specified significance level (MacKinnon and White 1985).
Bonferroni correction addresses the issue of p-hacking results by running multiple regressions. This paper estimates the MPC for 21 different nutrients. At a significance level of 0.05, at least one coefficient would be statistically significant due to randomness. Equation (8) gives the EER for an experiment with $c$ tests for significance. f
$$\alpha_{EER} = 1 - \left( 1 - \alpha_{indiv} \right)^{c}$$
( 8 )
At the individual significance levels of ($0.05,\ 0.01,\ 0.001)$, the EER becomes ($0.66,\ 0.19,\ 0.021)$ respectively. At the 0.05 significance level, there is a 66% chance of a significant result due to randomness. Bonferroni correction controls the EER by dividing the desired EER by the number of tests being conducted. After Bonferroni correction, the EER is guaranteed to be less than the desired significance level.
$$\alpha_{Bonferroni} = \frac{\alpha_{indiv}}{c}$$
( 9 )
| Table 2 - Descriptive Household Characteristics by USDA Target Group | ||||
|---|---|---|---|---|
| SNAP | Non-SNAP (<100% Poverty) | Non-SNAP (100-185% Poverty) |
Non-SNAP (>185% Poverty) |
|
| % Metro Household | 74.4% | 78.9% | 70.9% | 71.4% |
| Average Household Size | 3.42 | 2.79 | 2.79 | 2.72 |
| Average Household Income (Monthly) | $2,053 | $963 | $2,181 | $6,197 |
| Average Income as % of 2012 Poverty Guideline | 118.9% | 64.3% | 144% | 424% |
| Average Healthcare Cost | $35.84 | $49.80 | $101.32 | $182.89 |
| Average Childcare Cost | $15.74 | $7.65 | $13.10 | $35.83 |
| % Renting Home | 64.9% | 55.8% | 54.2% | 33.6% |
| % Owning Home | 29.9% | 38.4% | 43.5% | 64.6% |
| % Own Vehicle | 71.9% | 71.4% | 85.1% | 95% |
| % Receiving WIC | 18.8% | 8.1% | 9.3% | 2.8% |
| Time to Primary Store (Driving) | 8.63 | 8.12 | 8.96 | 9.26 |
| Time to Primary Store (Walking) | 15.08 | 15.27 | 14.84 | 15.75 |
| Cost of Travel to Primary Store | 3.85 | 1.22 | 1.21 | 8.3 |
| Self-Perceived Diet Quality (1-5) | 3.29 | 3.06 | 3.03 | 2.83 |
| % Think Healthy Food is Too Expensive | 50.2% | 41.9% | 47.2% | 34.2% |
| % Think Healthy Food is Too Time Consuming | 16.3% | 18.5% | 22.6% | 22.7% |
| Sample Size | 1581 | 346 | 851 | 2048 |
Data
The dataset used for analysis4 comes from the USDA National Household Food Acquisition Survey5 (FoodAPS). FoodAPS surveyed and tracked the food purchases and acquisitions for 4,826 households for one week in 2012 or 2013. FoodAPS was conducted with target stratification based on SNAP status and total household income. The four strata were 1) households receiving SNAP benefits (SNAP), 2) non-SNAP households with income less than the poverty guideline (non-SNAP, <100), 3) non-SNAP households with income between 100 percent and 185 percent of the poverty guideline (non- SNAP, 100-185), and 4) non-SNAP households with income equal or greater than 185 percent of the poverty guideline (non-SNAP, >185).
Table 2 details household characteristics for the four groups surveyed by the USDA. SNAP recipients are much more likely to receive WIC. Uptake of one food assistance program significantly raises the odds of uptake for multiple food assistance programs. It is important to correct for these effects when evaluating a single program like SNAP. If other food assistance programs (WIC, School Breakfasts, & School Lunches) are not accounted for, the study may overstate the effect of SNAP on nutrition by conflating its effects with the effects of other food assistance programs.
Furthermore, SNAP households have lower self-perceived diet quality and are more likely to think that healthy food is too expensive than non-participating households. Households on SNAP are more likely to rent, not have access to a vehicle, and be larger than households not on SNAP.
Table 3 details the average weekly nutrient consumption by the USDA target group. Because FoodAPS only tracks the acquisition of foods and nutrients, the actual consumption habits of households remain unobserved. Households in developed nations are responsible for the majority of food waste (Porpino 2016). Therefore, conclusions from purchasing patterns likely overstate the total household consumption of a nutrient. A comparison of household consumption patterns assumes that the level of food waste is similar across socioeconomic groups. This assumption may not hold at higher income levels but should hold in the range of the restrictions used for estimating consumption patterns. Therefore, the statistics in Table 3 are valid for comparison across groups but likely overstate the absolute level of consumption.
The consumption characteristics of SNAP households are most closely matched by the non-SNAP households below 185% of the poverty guideline. Compared to households above 185% of the poverty guideline, both groups consume higher quantities of calories, total sugars, total fats, cholesterol, and saturated fats. Limiting the consumption of added sugars and saturated fats is critical to developing healthy dietary patterns at every stage of life and reducing the risk of diet-related chronic illnesses, including obesity, heart disease, type 2 diabetes, and cancer (United States Department of Agriculture 2020). Wealthier households purchase foods with higher micro-nutritional quality than lower-income households. Non-SNAP households above 185% of the poverty guideline purchased foods higher in calcium, phosphorus, magnesium, vitamin A, and vitamin C. Eligible non-participants consume the least calories out of any group in the survey.
| Table 3 – Total Weekly Nutrient Consumption per AME | ||||
|---|---|---|---|---|
| SNAP | Non-SNAP (<100% Poverty) | Non-SNAP (100-185% Poverty) |
Non-SNAP (>185% Poverty) |
|
| Macronutrients | ||||
| Energy (kCal) | 24,546 | 21,200 | 24,766 | 23,706 |
| Carbs (g) | 3,259 | 2,872 | 3,239 | 3,138 |
| Dietary Fiber (g) | 157 | 165 | 179 | 185 |
| Total Sugar (g) | 1,627 | 1,387 | 1,548 | 1,500 |
| Total Fat (g) | 999 | 817 | 1,025 | 937 |
| Saturated Fat (g) | 313 | 260 | 322 | 304 |
| Monounsaturated Fat (g) | 355 | 297 | 359 | 330 |
| Polyunsaturated Fat (g) | 258 | 201 | 269 | 233 |
| Protein (g) | 679 | 587 | 706 | 688 |
| Micronutrients | ||||
| Cholesterol (mg) | 2,380 | 2,028 | 2,540 | 2,277 |
| Sodium (mg) | 44,334 | 43,979 | 46,583 | 40,221 |
| Vitamin A (mcg) | 7,033 | 6,598 | 7,860 | 8,004 |
| Vitamin B6 (mg) | 20 | 18 | 21 | 21 |
| Vitamin B12 (mcg) | 58 | 46 | 58 | 57 |
| Vitamin C (mg) | 752 | 733 | 853 | 859 |
| Iron (mg) | 176 | 159 | 186 | 176 |
| Thiamin (mg) | 18 | 16 | 19 | 18 |
| Riboflavin (mg) | 21 | 18 | 22 | 22 |
| Calcium (mg) | 10,350 | 9,162 | 10,998 | 11,082 |
| Phosphorus (mg) | 13,513 | 11,771 | 14,275 | 14,275 |
| Magnesium (mg) | 2,773 | 2,679 | 3,101 | 3,162 |
| Sample Size | 1,268 | 259 | 707 | 1,703 |
| Table 4 – Estimates for Marginal Propensity to Consume (MPC) per Dollar of SNAP Benefit by Nutrient | |||
|---|---|---|---|
| Restriction | Groups 1 & 4 (n=1,527) |
Groups 1, 2, & 4 (n=2,234) |
Groups 2 & 4 (n=1,975) |
| Macronutrients | |||
| Energy (kCal) | 22.9** (2.95) |
21.4** (5.41) |
24.3*** (3.86) |
| Carbs (g) | 2.94** (0.826) |
2.62** (0.706) |
2.99** (0.76) |
| Dietary Fiber (g) | 0.0813 (0.0402) |
0.0567 (0.0355) |
0.0728 (0.0386) |
| Total Sugar (g) | 1.67** (0.438) |
1.55*** (0.374) |
1.77*** (0.397) |
| Total Fat (g) | 0.942* (0.298) |
0.904* (0.261) |
1.04** (0.285) |
| Saturated Fat (g) | 0.341** (0.0966) |
0.31** (0.0809) |
0.353*** (0.0864) |
| Monounsaturated Fat (g) | 0.330 (0.112) |
0.33* (0.0985) |
0.396** (0.107) |
| Polyunsaturated Fat (g) | 0.193 (0.0853) |
0.185 (0.0794) |
0.209 (0.0892) |
| Protein (g) | 0.738** (0.207) |
0.69** (0.179) |
0.743** (0.191) |
| Micronutrients | |||
| Cholesterol (mg) | 3.01* (0.894) |
2.80* (0.803) |
3.02** (0.861) |
| Sodium (mg) | 34.7 (23.3) |
40.97 (18.8) |
42.3 (20.0) |
| Vitamin A (mcg) | 5.51 (2.25) |
6.07 (2.27) |
7.15 (2.48) |
| Vitamin B6 (mg) | 0.0126 (0.0059) |
0.0139 (0.005) |
0.0152 (0.0054) |
| Vitamin B12 (mcg) | 0.0649 (0.0218) |
0.0713* (0.0215) |
0.0741* (0.0232) |
| Vitamin C (mg) | 0.510 (0.203) |
0.391 (0.178) |
0.512 (0.193) |
| Iron (mg) | 0.127 (0.0501) |
0.112 (0.0424) |
0.127 (0.0465) |
| Thiamin (mg) | 0.0123 (0.0051) |
0.011 (0.0043) |
0.0125 (0.0047) |
| Riboflavin (mg) | 0.0185* (0.0058) |
0.0171* (0.0049) |
0.019* (0.0053) |
| Calcium (mg) | 10.6* (3.07) |
9.08** (2.58) |
10.28** (2.77) |
| Phosphorus (mg) | 13.7* (3.94) |
12.13** (2.33) |
13.26** (3.59) |
| Magnesium (mg) | 2.21 (0.673) |
1.80 (0.593) |
2.08* (0.635) |
Target group definitions: (1) SNAP eligible households not participating, (2) SNAP non-eligible households under 185% of the Federal poverty guideline, (4) participating SNAP households. Robust standard errors presented in parenthesis. *, (**), [***] indicate Bonferroni corrected statistical significance at the 0.05, (0.01), [0.001] level. |
|||
Results
OLS estimates for the MPC for a given nutrient are presented in Table 4. Each column corresponds to a different restriction. Restriction (column) one contains only SNAP-eligible households, including non-participants. Restriction (column) two adds non-eligible non-participants under 185% of the poverty guidelines. Restriction (column) three only considers SNAP households and non-eligible non-participants under 185% of the poverty guideline. Self-selection into SNAP may understate results, and based on estimates across the different restrictions, there is strong evidence of endogenous selection. When eligible non-participants are not considered (restriction three), almost every estimate increases in magnitude. For this reason, MPC estimates from restriction (column) three are used for comparative analysis. Full regression estimates for all coefficients including controls are available in Tables 1-6 in the appendix.
Every MPC was positive, which indicates that SNAP benefits increase the consumption of almost all food goods. If food is a normal good, this is the expected result. Energy (kCal), carbohydrates, total sugars, total fats, saturated fats, monounsaturated fats, and protein have statistically significant MPC estimates, indicating a significant increase in the consumption of almost all macronutrients. The major outlier is dietary fiber. An increase in SNAP benefits did not correspond to an increased MPC for dietary fiber. Many important sources of dietary fiber include whole grains, vegetables, and fruits (United States Department of Agriculture 2020). This indicates that SNAP benefits do not increase consumption equally across the board.
All micronutrients were estimated to have a positive MPC, but only cholesterol, vitamin B12, riboflavin, phosphorus, calcium, and magnesium were statistically significant at the 0.05 significance level. The combined increase of cholesterol, calcium, saturated fats, and proteins indicates that SNAP benefits greatly increase a household’s MPC for meat and dairy products.
Directly comparing MPCs paints an inadequate picture of how SNAP affects diet quality. Direct comparisons between nutrients of incompatible units are impossible, and even when units are the same, dietary guidelines may differ. For example, comparing an MPC of 1.77g for total sugars with an MPC of 0.743g for proteins has vastly different implications on an individual’s diet. To account for these differences, the coefficients from restriction (column) three are recalculated as percentages of the recommended daily allowance (RDA) as determined by the USDA6. RDAs differ by age, gender, and body mass. Furthermore, medical conditions like diabetes also change RDAs. This is also true of pregnancy. For standardization and comparison purposes, only the RDA for a male and a female between 19-50 years of age was used.
Figure 1 represents the coefficients as percentages of RDAs for adult men and women. Table 7 in the appendix contains the RDA for men and women and the MPC estimates as a percentage of RDAs. After adjustment, it becomes clear that SNAP has the greatest impact on the consumption of carbohydrates and total sugars, with a 3% increase by RDA. Total sugars include both added and natural, so it is difficult to identify whether this increased consumption has positive or negative health impacts. Vitamin B12, phosphorus, and riboflavin had the greatest increases in consumption when adjusting for RDA. This indicates that SNAP improves the nutrition density of the foods consumed. Proteins, saturated fats, calcium, and cholesterol consumption increased by 1% by RDA per dollar. This indicates increased consumption of meats and dairy. Moderate consumption of these foods may improve health, but chronic overconsumption may lead to many diet-related health issues.
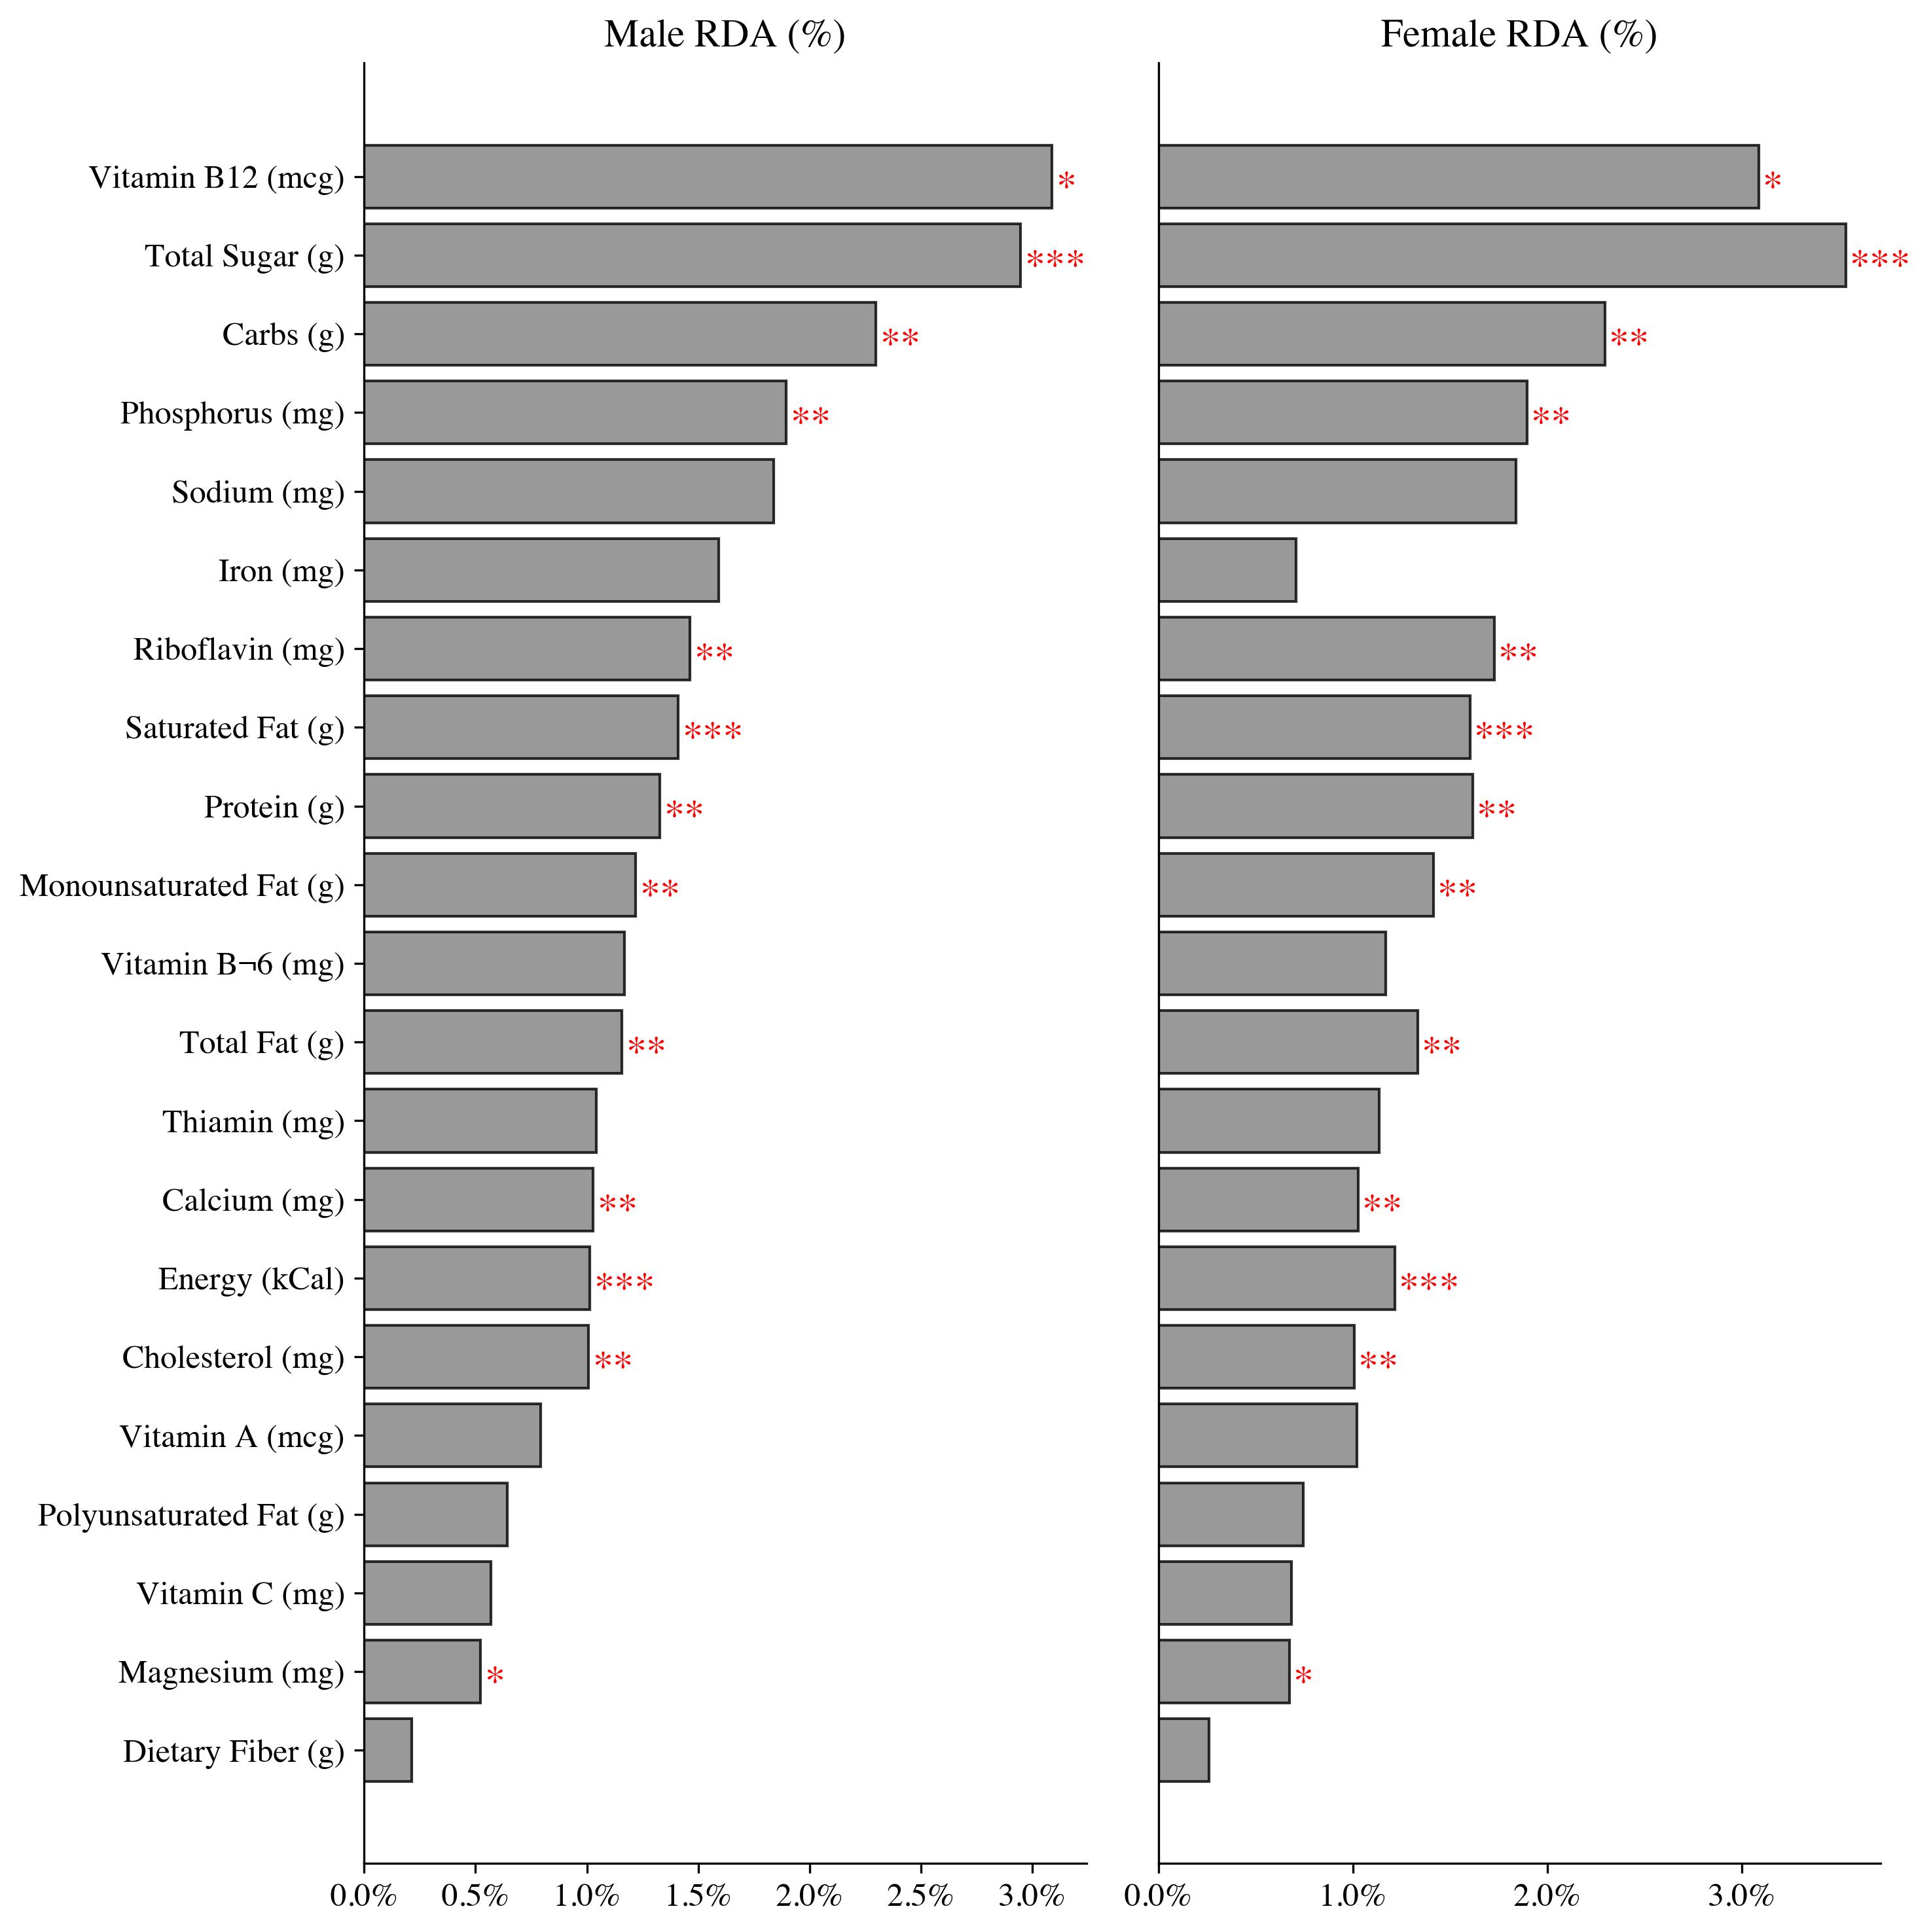
Figure 1 - Estimated MPC as % of RDA
Conclusion
SNAP benefits increase the consumption of all nutrients. These increases are not equal across the board. SNAP benefits increased the micronutrient density of food purchases, including vitamin B12, phosphorus, riboflavin, and calcium. This points to an increase in the diversity of food purchases due to SNAP benefits. SNAP benefits most significantly increase the consumption of carbohydrates and total sugars. Finally, SNAP benefits also increase the consumption of proteins, saturated fats, and cholesterol, indicating increased consumption of meat and dairy.
Taken together, it can be concluded that SNAP benefits moderately increase the diversity and quality of participants' diets but still contribute to unhealthy overconsumption of calories. Examining these findings in the broader context of demand for healthy food leads to the conclusion that monetary costs play only a partial role in the demand for unhealthy food among Americans. Simply increasing transfer payments in the form of food assistance programs will not solve systemic issues surrounding diet-related disorders, including obesity, type 2 diabetes, heart disease, stroke, and certain cancers.
This does not mean that SNAP and other food assistance programs are totally ineffective. SNAP has been shown to have other benefits, including reducing food insecurity and hunger (Andreyeva, Tripp, and Schwartz 2015). This paper’s findings are in line with previous findings, which concluded that SNAP does increase nutrient consumption, but the overall impact of SNAP on diet quality remains inconclusive (Devaney and Moffitt 1991; Gregory et al. 2013).
Future avenues for research include evaluating other determinants and solutions for demand and improving estimates of the effects of transfer payments on nutrition. Most studies have shown that SNAP does decrease food insecurity but has limited or mixed impacts on nutrition (Andreyeva, Tripp, and Schwartz 2015). Improving these estimates will better quantify the exact effects of SNAP on nutrient demand. Current estimates suffer from two problems 1) self-selection bias in the program and 2) a focus on purchases and acquisitions. Self-selection into SNAP means that participants are likely to have worse diet qualities compared to non-participants leading to an understatement of the true effects of SNAP on nutrition. One potential approach to improve estimates is to exploit the geographic variability in policy because SNAP administration varies by state. Utilizing restricted FoodAPS data is an easy way to improve estimates for any researchers granted access.
Many studies, including this paper, either utilize scanner data from data syndicators like Nielson or food acquisition data. Unfortunately, a household’s food purchases may not reflect the true nutritional content of their diet. Scanner and acquisition data ignore the problem of food waste. Food waste patterns may differ with income and food group. Perishable items like fresh fruits and vegetables are more likely to be thrown out compared to items with longer shelf lives, like canned foods and highly processed shelf-stable goods. These food waste patterns may skew the true impact of SNAP on nutrition because an increase in fruit and vegetable purchases may not correspond to as large of an increase in fruit and vegetable consumption.
Beyond improving estimates, other determinants of nutrient demand and potential solutions must be evaluated to wholly address nutrition insecurity in the United States. Government interventions for improving nutrition include mandates, restrictions in public spaces, economic incentives, marketing limits, information provision, and environmental defaults (Gorski and Roberto 2015). Despite its importance, nutrition is a single component of health. Addressing the broader problem of the obesity epidemic and socioeconomic disparities in health means accounting for physical exercise, access to healthcare, and transportation design.
References
Allcott et al. 2018. “The Geography of Poverty and Nutrition: Food Deserts and Food Choices Across the United States.” Stanford Graduate School of Business. 2018. https://www.gsb.stanford.edu/faculty-research/working-papers/geography-poverty-nutrition-food-deserts-food-choices-across-united.
Andreyeva, Tatiana, Amanda S. Tripp, and Marlene B. Schwartz. 2015. “Dietary Quality of Americans by Supplemental Nutrition Assistance Program Participation Status A Systematic Review.” American Journal of Preventive Medicine 49, no. 4 (October): 594–604. https://doi.org/10.1016/j.amepre.2015.04.035.
Bitler, Marianne. 2014. “The Health and Nutrition Effects of SNAP: Selection Into the Program and a Review of the Literature on Its Effects.” University of Kentucky Center for Poverty Research Discussion Paper Series DP2014-02, no. January (January): 1–46.
Devaney, Barbara, and Robert Moffitt. 1991. “Dietary Effects of the Food Stamp Program.” American Journal of Agricultural Economics 73, no. 1: 202–11. https://doi.org/10.2307/1242896.
Dubois, Pierre, Rachel Griffith, and Aviv Nevo. 2014. “Do Prices and Attributes Explain International Differences in Food Purchases?” American Economic Review 104, no. 3 (March): 832–67. https://doi.org/10.1257/aer.104.3.832.
Gorski, Mary T, and Christina A Roberto. 2015. “Public Health Policies to Encourage Healthy Eating Habits: Recent Perspectives.” Journal of Healthcare Leadership 7, no. September (September): 81–90. https://doi.org/10.2147/JHL.S69188.
Gregory, Christian, Michele Ver Ploeg, Margaret Andrews, and Alisha Coleman-Jensen, eds. 2013. Supplemental Nutrition Assistance Program (SNAP) Participation Leads to Modest Changes in Diet Quality. Economic Research Report Number 147. https://doi.org/10.22004/ag.econ.262225.
“Human Energy Requirements: Report of a Joint FAO/ WHO/UNU Expert Consultation.” 2005. Food and Nutrition Bulletin 26, no. 1 (March): 166.
MacKinnon, James G, and Halbert White. 1985. “Some Heteroskedasticity-Consistent Covariance Matrix Estimators with Improved Finite Sample Properties.” Journal of Econometrics 29, no. 3 (September): 305–25. https://doi.org/10.1016/0304-4076(85)90158-7.
Mozaffarian, Dariush, Sheila Fleischhacker, and José R. Andrés. 2021. “Prioritizing Nutrition Security in the US.” JAMA 325, no. 16 (April): 1605–6. https://doi.org/10.1001/jama.2021.1915.
Petersen, Ruth. 2019. “Racial and Ethnic Disparities in Adult Obesity in the United States: CDC’s Tracking to Inform State and Local Action.” Preventing Chronic Disease 16. https://doi.org/10.5888/pcd16.180579.
Porpino, Gustavo. 2016. “Household Food Waste Behavior: Avenues for Future Research.” Journal of the Association for Consumer Research 1, no. 1 (January): 41–51. https://doi.org/10.1086/684528.
Ratcliffe, Caroline, Signe-Mary McKernan, and Sisi Zhang. 2011. “How Much Does the Supplemental Nutrition Assistance Program Reduce Food Insecurity?” American Journal of Agricultural Economics 93, no. 4: 1082–98. https://doi.org/10.1093/ajae/aar026.
Schofield, W N. 1985. “Predicting Basal Metabolic Rate, New Standards and Review of Previous Work.” Human Nutrition Clinical Nutrition 39 Suppl 1, no. January (January): 5–41.
Temple, Norman J. 2022. “The Origins of the Obesity Epidemic in the USA–Lessons for Today.” Nutrients 14, no. 20 (October): 4253. https://doi.org/10.3390/nu14204253.
United States Department of Agriculture. 2020. “Dietary Guidelines for Americans, 2020-2025,” December (December). https://www.dietaryguidelines.gov/resources/2020-2025-dietary-guidelines-online-materials.
United States Department of Agriculture 2021. “Thrifty Food Plan.” https://www.fns.usda.gov/resource/thrifty-food-plan-2021.
Zhen, Chen. 2021. “Food Deserts: Myth or Reality?” Annual Review of Resource Economics 13, no. 1: 109–29. https://doi.org/10.1146/annurev-resource-101620-080307.
Appendix
| Appendix 1: Macronutrient Regression Results for Restriction 2 (SNAP Households & Eligible Non-Participants) | ||||||||||
|---|---|---|---|---|---|---|---|---|---|---|
| Energy (kCal) | Carbs (g) | Dietary Fiber (g) | Total Sugar (g) | Total Fat (g) | Saturated Fat (g) | Monounsaturated Fat (g) | Polyunsaturated Fat (g) | Protein (g) | Sodium (mg) | |
| Constant | 1,418*** (2,811) |
2,113*** (364.8) |
109.4*** (18.44) |
979.3*** (206.5) |
456.7* (147.1) |
167.2** (46.89) |
150.3 (57.44) |
102.3 (44.84) |
402.5*** (79.94) |
2,488 (9,171) |
| MPC SNAP | 22.87** (6.268) |
2.946** (0.826) |
0.08129 (0.04017) |
1.665** (0.4382) |
0.9418* (0.2978) |
0.3406** (0.09664) |
0.3299 (0.1122) |
0.1928 (0.08533) |
0.7383** (0.2065) |
34.69 (23.31) |
| Income | 2.728 (1.381) |
0.2392 (0.1732) |
0.01978 (0.007672) |
0.0717 (0.1173) |
0.1582 (0.07549) |
0.02551 (0.034) |
0.06683 (0.02619) |
0.05617 (0.01974) |
0.0718 (0.03158) |
1.778 (4.587) |
| Income2 | -9.125e-05 (0.00021) |
-5.035e-06 (2.64e-05) |
-1.09e-06 (9.947e-07) |
4.743e-06 (1.972e-05) |
-4.97e-06 (1.099e-05) |
1.996e-06 (6.493e-06) |
-3.191e-06 (2.822e-06) |
-3.358e-06 (1.594e-06) |
-4.518e-06 (3.594e-06) |
3.618e-05 (0.0005985) |
| School Breakfast | -7,048*** (1,403) |
-870.3*** (188.6) |
-52.82*** (9.473) |
-407.6** (107.2) |
-302.8*** (66.44) |
-90.29*** (20.73) |
-110.9*** (24.99) |
-81.6*** (19.81) |
-206.4*** (42.97) |
-2,189*** (4,645) |
| WIC | 160.9 (1,805) |
-52.78 (232) |
1.219 (12.42) |
-51.76 (118.4) |
32.09 (94.53) |
9.813 (26.23) |
14.12 (35.69) |
2.78 (31.81) |
30.89 (53.75) |
1,112 (5,481) |
| Female Head | 5,671** (1,535) |
752.8** (201.2) |
32.41 (10.89) |
450.3** (112) |
268.8* (78.86) |
73.79* (24.12) |
103.8* (29.78) |
76.46* (24.9) |
105.9 (49.03) |
8,753 (7,103) |
| Black | -4,636 (1,917) |
-671.1 (260.8) |
-42.22** (11.46) |
-343.7 (159.4) |
-132.6 (93.54) |
-88.65* (27.77) |
-34.49 (35.53) |
3.693 (29.44) |
-177.8* (54.73) |
-1,093 (6,699) |
| Hispanic | -2,885 (1,543) |
-217.3 (215.8) |
1.865 (12.46) |
-177 (121.6) |
-176.1 (77) |
-81.95** (21.32) |
-66.55 (30.87) |
-14.2 (26.45) |
-84.34 (43.17) |
-6,605 (5,836) |
| Midwest | 4,160 (2,538) |
358 (331) |
12.8 (16.8) |
176.6 (177.8) |
217.2 (124.8) |
84.99 (39.04) |
84.33 (49.55) |
28.17 (35.82) |
197.6 (80.67) |
1,847 (8,026) |
| South | 781 (2,010) |
10.65 (268) |
8.079 (13.64) |
38.64 (153.9) |
48.59 (103) |
9.024 (31.49) |
17.57 (38.21) |
17.32 (32.84) |
51.22 (58.6) |
1,677 (7,623) |
| West | -2,011 (2,082) |
-447.2 (278.9) |
-3.702 (14.01) |
-235.2 (158.2) |
-23.73 (108.5) |
9.809 (34.35) |
-19.11 (39.73) |
-14.15 (34.84) |
-12.94 (56.85) |
-721.8 (5,262) |
| Guest Meals | 2,507 (969.9) |
382.2 (148.9) |
16.69 (7.075) |
242.4 (91.98) |
89.98 (37.21) |
32.23 (11.88) |
32.91 (14.62) |
18.51 (10.22) |
53.17 (28.8) |
1,182 (7,008) |
| Non-Metro | 4,328 (2,934) |
559.5 (391.8) |
2.757 (16.6) |
214.1 (207.5) |
180.5 (130.8) |
79.68 (42.82) |
43.5 (47.07) |
43.65 (39.17) |
142.2 (93.34) |
1,181 (7,867) |
| Appendix 2: Micronutrient Regression Results for Restriction 1 (SNAP Households + Eligible Non-Participants) | |||||||||||
|---|---|---|---|---|---|---|---|---|---|---|---|
| Cholesterol (mg) | Vitamin A (mcg) | Vitamin B¬6 (mg) | Vitamin B12 (mcg) | Vitamin C (mg) | Iron (mg) | Thiamin (mg) | Riboflavin (mg) | Calcium (mg) | Phosphorus (mg) | Magnesium (mg) | |
| Constant | 1,185* (373.6) |
4,625*** (919.1) |
12.8*** (2.453) |
35.49*** (7.945) |
491*** (110.2) |
96.74*** (21.82) |
10.58*** (2.134) |
11.81*** (2.19) |
6,097*** (1,123) |
8,061*** (1,446) |
2,063*** (297.7) |
| MPC SNAP | 3.014* (0.8947) |
5.513 (2.249) |
0.01259 (0.005933) |
0.06494 (0.02179) |
0.5099 (0.2033) |
0.1265 (0.05009) |
0.01226 (0.005106) |
0.01852* (0.005815) |
10.6* (3.074) |
13.73* (3.944) |
2.213* (0.6733) |
| Income | 0.2975 (0.1832) |
0.9629 (0.4247) |
0.00274 (0.001009) |
0.006204 (0.002992) |
0.113 (0.04524) |
0.02733 (0.009447) |
0.002469* (0.0007858) |
0.002935* (0.0009106) |
1.242 (0.482) |
1.458 (0.634) |
0.337 (0.1233) |
| Income2 | -1.181e-05 (2.381e-05) |
-3.613e-05 (6.363e-05) |
-1.823e-07 (8.996e-08) |
-4.32e-07 (2.661e-07) |
-4.841e-06 (5.518e-06) |
-1.471e-06 (1.034e-06) |
-1.85e-07 (6.429e-08) |
-1.698e-07 (1.004e-07) |
-6.128e-05 (6.191e-05) |
-7.009e-05 (8.735e-05) |
-1.703e-05 (1.451e-05) |
| School Breakfast | -835.5*** (170.9) |
-2,321*** (421.1) |
-5.514*** (1.342) |
-16.01** (4.45) |
-264.1*** (54.44) |
-43.64** (11.42) |
-4.113** (1.132) |
-4.705*** (1.144) |
-2,948*** (582.1) |
-3,973*** (758.1) |
-931.4*** (153.6) |
| WIC | -51.38 (201.3) |
188.8 (547.9) |
1.368 (1.686) |
2.943 (5.108) |
95.31 (69.64) |
26.93 (16) |
1.808 (1.569) |
2.66 (1.591) |
1,145 (767.1) |
974.1 (999.4) |
-93.55 (188.6) |
| Female Head | 304.6 (235.4) |
1,375 (627.8) |
2.886 (1.732) |
5.519 (6.015) |
105.2 (65.74) |
26.53 (13.54) |
2.896 (1.258) |
2.708 (1.331) |
1,486 (703.5) |
2,186 (864.4) |
493.1 (181.6) |
| Black | -475.5 (242.9) |
-2,053* (609.4) |
-4.147 (1.706) |
-12.83 (5.585) |
-45.93 (79.28) |
-23.52 (14.52) |
-2.865 (1.418) |
-5.648** (1.429) |
-3,243*** (772.8) |
-4,164*** (969.1) |
-956.2*** (187.1) |
| Hispanic | 154.5 (231.6) |
-1,230 (485.2) |
-0.3727 (1.617) |
-6.35 (4.741) |
204.3 (73.63) |
-5.277 (14.96) |
-0.315 (1.408) |
-1.523 (1.354) |
-1,426 (600.8) |
-1,470 (801.5) |
-207.2 (185.1) |
| Midwest | 737.6 (333.9) |
1,234 (918.9) |
3.803 (2.383) |
15.56 (8.36) |
-19.69 (96.05) |
25.89 (19.61) |
2.745 (1.992) |
4.269 (2.116) |
3,066 (1,167) |
3,758 (1,451) |
251 (295.2) |
| South | 262.1 (256.7) |
-283.2 (668) |
1.037 (1.814) |
2.527 (6.411) |
-61.7 (83.48) |
9.721 (16.43) |
0.973 (1.607) |
0.5713 (1.589) |
64.75 (819) |
739.5 (1,041) |
-115.8 (233.1) |
| West | -118.8 (266.7) |
293.3 (746.7) |
1.819 (2.158) |
4.219 (6.525) |
-39.16 (88.27) |
5.497 (19.23) |
-0.7429 (1.758) |
0.4066 (1.732) |
497.3 (879.7) |
-197.5 (1,060) |
-151.1 (246.4) |
| Guest Meals | 264.4 (109.8) |
536.5 (245) |
1.232 (0.7262) |
2.868 (2.211) |
82.71 (30.95) |
12.4 (6.964) |
1.515 (0.6511) |
1.652 (0.6917) |
763.1 (368.7) |
1,050 (512.3) |
196.6 (104.8) |
| Non-Metro | 615.5 (427.7) |
1,609 (989.4) |
1.645 (2.568) |
10.07 (7.882) |
-39.08 (96.7) |
26.81 (20.93) |
3.083 (2.172) |
5.492 (2.368) |
3,323 (1,337) |
3,156 (1,617) |
544.6 (336.9) |
| Appendix 3: Macronutrient Regression Results for Restriction 2 (SNAP Households, Eligible Non-Participants, & Non-Eligible Households <185% of Poverty Guideline) | ||||||||||
|---|---|---|---|---|---|---|---|---|---|---|
| Energy (kCal) | Carbs (g) | Dietary Fiber (g) | Total Sugar (g) | Total Fat (g) | Saturated Fat (g) | Monounsaturated Fat (g) | Polyunsaturated Fat (g) | Protein (g) | Sodium (mg) | |
| Constant | 1,386*** (2,632) |
2,169*** (341.3) |
111.2*** (20.85) |
932.7*** (182.3) |
418.2* (136.4) |
152.1** (43.34) |
127.2 (49.93) |
104.9 (47.87) |
379.2*** (67.55) |
2.424e+04* (7,932) |
| MPC SNAP | 21.35** (5.415) |
2.624** (0.706) |
0.05674 (0.03546) |
1.552*** (0.3743) |
0.9048* (0.2613) |
0.3102** (0.08093) |
0.3335* (0.09847) |
0.185 (0.07945) |
0.6903** (0.1794) |
40.97 (18.82) |
| Income | 4.294** (1.216) |
0.4384 (0.1546) |
0.03256*** (0.006833) |
0.1799 (0.1069) |
0.2212* (0.06511) |
0.05185 (0.03116) |
0.08536** (0.02169) |
0.06859*** (0.01591) |
0.1322*** (0.0287) |
5.011 (3.94) |
| Income2 | -0.0001903 (0.0001977) |
-1.731e-05 (2.493e-05) |
-1.858e-06 (9.345e-07) |
-1.931e-06 (1.879e-05) |
-9.115e-06 (1.031e-05) |
2.536e-07 (6.204e-06) |
-4.382e-06 (2.587e-06) |
-4.203e-06 (1.405e-06) |
-8.428e-06 (3.364e-06) |
-0.0002194 (0.0005513) |
| School Breakfast | -6,490*** (1,153) |
-791.3*** (155.7) |
-52.78*** (8.254) |
-338.4** (87.23) |
-282.6*** (55.1) |
-82.7*** (16.78) |
-102.9*** (20.49) |
-78.52*** (17.48) |
-197*** (34.49) |
-2.182e+04*** (3,863) |
| WIC | -740.6 (1,501) |
-102.8 (195.6) |
-6.735 (10.58) |
-34.02 (99.97) |
-30.19 (77.99) |
-9.676 (21.54) |
-9.642 (29.34) |
-11.12 (26.5) |
-5.123 (44.34) |
-620 (4,718) |
| Female Head | 4,354* (1,264) |
518.4* (166.4) |
28.71 (9.702) |
298.9* (91.06) |
245** (65) |
58.52 (19.59) |
99.29*** (23.99) |
76.25* (21.95) |
59.26 (43.27) |
5,895 (5,748) |
| Black | -4,189 (1,613) |
-605.3 (219.4) |
-37.22** (10.35) |
-327.6 (130.6) |
-131.4 (79.3) |
-88.04** (23.16) |
-34.75 (29.87) |
4.754 (25.51) |
-154.6* (45.48) |
-9,496 (5,648) |
| Hispanic | -3,107 (1,275) |
-305.7 (176.7) |
-4.49 (10.63) |
-206.1 (97.35) |
-173 (64.17) |
-73.05** (18.34) |
-65.18 (25.26) |
-21.95 (22.49) |
-73.66 (36.6) |
-6,598 (4,832) |
| Midwest | 3,103 (2,241) |
221.3 (290.4) |
1.725 (19.23) |
183.9 (137.5) |
164.2 (113.1) |
71.17 (30.78) |
65.75 (41) |
10.22 (42.61) |
184.7 (66.57) |
2.215e+04* (7,176) |
| South | 664.5 (1,937) |
1.55 (252.7) |
-0.1225 (17.34) |
110.6 (122.6) |
40.21 (98.39) |
15.97 (26.13) |
22.37 (34.17) |
-2.153 (38.91) |
49.07 (50.09) |
1.517e+04 (6,166) |
| West | -2,094 (2,005) |
-451.6 (263.5) |
-8.249 (17.93) |
-170.9 (128.1) |
-37.08 (102.4) |
11.16 (28.31) |
-17.27 (35.24) |
-30.31 (40.27) |
-1.402 (50.77) |
383.3 (4,762) |
| Guest Meals | 2,083 (732.3) |
287.2 (103.9) |
12.71 (5.245) |
174.9 (62.69) |
88.32 (33.75) |
28.95 (9.935) |
33.81 (12.93) |
19.82 (10.41) |
41.88 (20.82) |
7,286 (4,384) |
| Non-Metro | 4,703 (2,327) |
492.4 (311.3) |
3.89 (14.01) |
291.2 (188.2) |
233.4 (116) |
100.8 (36.92) |
66.44 (42.51) |
44.58 (35.85) |
177.4 (92.53) |
1,002 (7,201) |
| Appendix 4: Micronutrient Regression Results for Restriction 2 (SNAP Households, Eligible Non-Participants, & Non-Eligible Households <185% of Poverty Guideline) | |||||||||||
|---|---|---|---|---|---|---|---|---|---|---|---|
| Cholesterol (mg) | Vitamin A (mcg) | Vitamin B¬6 (mg) | Vitamin B12 (mcg) | Vitamin C (mg) | Iron (mg) | Thiamin (mg) | Riboflavin (mg) | Calcium (mg) | Phosphorus (mg) | Magnesium (mg) | |
| Constant | 984.8* (312.6) |
3,724*** (849.5) |
11.97*** (2.145) |
28.06*** (6.82) |
457.7*** (98.68) |
99.95*** (21.03) |
10.88*** (2.047) |
10.84*** (1.867) |
5,610*** (977.3) |
7,635*** (1,301) |
2,036*** (311.2) |
| MPC SNAP | 2.803* (0.8025) |
6.065 (2.268) |
0.01391 (0.005007) |
0.0713* (0.02145) |
0.3905 (0.1797) |
0.1117 (0.04242) |
0.011 (0.004287) |
0.01708* (0.004908) |
9.082** (2.584) |
12.13** (3.339) |
1.8 (0.5931) |
| Income | 0.5323* (0.1594) |
1.694** (0.4203) |
0.004095*** (0.0008576) |
0.01182** (0.003072) |
0.1853*** (0.04108) |
0.03889*** (0.008059) |
0.003697*** (0.0007093) |
0.00447*** (0.0007936) |
2.048*** (0.4286) |
2.58*** (0.5642) |
0.5933*** (0.1118) |
| Income2 | -2.759e-05 (2.222e-05) |
-8.433e-05 (6.139e-05) |
-2.682e-07* (8.504e-08) |
-8.009e-07 (2.865e-07) |
-9.22e-06 (5.257e-06) |
-2.148e-06 (9.478e-07) |
-2.596e-07*** (6.088e-08) |
-2.639e-07 (9.304e-08) |
-0.0001107 (5.753e-05) |
-0.000141 (8.134e-05) |
-3.293e-05 (1.331e-05) |
| School Breakfast | -781.3*** (141.3) |
-2,038*** (351.9) |
-4.575*** (1.098) |
-12.04* (3.636) |
-242.2*** (45.11) |
-42.95*** (9.419) |
-3.915*** (0.9481) |
-4.369*** (0.9393) |
-2,688*** (478.7) |
-3,765*** (624.2) |
-907.4*** (131.2) |
| WIC | -192.6 (168.5) |
-107.8 (470.3) |
0.2826 (1.397) |
-0.2051 (4.299) |
85.21 (59.63) |
22.01 (13.66) |
1.075 (1.316) |
2.028 (1.326) |
840.2 (641.7) |
267.7 (825.6) |
-199.7 (159.7) |
| Female Head | 173 (195.5) |
945.6 (536.8) |
1.093 (1.415) |
1.647 (5.122) |
44.33 (54.92) |
16.63 (11.55) |
1.842 (1.156) |
2.105 (1.085) |
1,334 (561) |
1,592 (719.7) |
335 (158.1) |
| Black | -356.1 (210.7) |
-1,945* (596) |
-3.607 (1.479) |
-12.59 (5.23) |
-51.65 (70.07) |
-25.94 (12.4) |
-3.196 (1.221) |
-5.866*** (1.202) |
-3,317*** (631.1) |
-3,896*** (804.8) |
-809.4*** (176.8) |
| Hispanic | 257.1 (193.6) |
-1,372* (407.1) |
-0.7221 (1.3) |
-7.459 (3.814) |
162.2 (62.29) |
-11.42 (12.24) |
-0.7976 (1.177) |
-1.872 (1.121) |
-1,351 (529.1) |
-1,383 (696.3) |
-253.9 (159.7) |
| Midwest | 736 (262.3) |
1,593 (744.8) |
4.015 (1.968) |
18.86 (6.694) |
18.61 (79.54) |
19.89 (18.86) |
2.385 (1.94) |
3.977 (1.658) |
2,321 (894.7) |
3,130 (1,192) |
138.4 (289.6) |
| South | 370.1 (206.4) |
251.7 (568.4) |
1.064 (1.582) |
5.771 (5.013) |
-39.69 (69.66) |
6.929 (16.37) |
0.3504 (1.606) |
1.197 (1.335) |
288.7 (680.9) |
827.2 (951.7) |
-145.3 (254.7) |
| West | -31.46 (217.7) |
604.9 (618.4) |
1.627 (1.831) |
6.732 (5.185) |
-2.688 (76.67) |
1.748 (18.33) |
-1.2 (1.721) |
0.5967 (1.462) |
699.3 (756.3) |
12.15 (997.8) |
-180 (267.3) |
| Guest Meals | 236 (86.41) |
435.6 (202.5) |
0.9148 (0.5518) |
1.722 (1.58) |
73.6 (27.13) |
8.632 (4.967) |
1.075 (0.5046) |
1.15 (0.5252) |
722.6 (288.1) |
927.4 (383.1) |
141.7 (75.78) |
| Non-Metro | 784.9 (388.2) |
1,583 (803.1) |
3.51 (2.443) |
17.78 (8.512) |
25.42 (86.21) |
26.76 (18.46) |
4.005 (2.323) |
5.522 (2.008) |
2,837 (1,026) |
3,102 (1,337) |
439.7 (265.7) |
| Appendix 5: Macronutrient Regression Results for Restriction 3 (SNAP Households & Non-Eligible Households <185% of Poverty Guideline) | ||||||||||
|---|---|---|---|---|---|---|---|---|---|---|
| Energy (kCal) | Carbs (g) | Dietary Fiber (g) | Total Sugar (g) | Total Fat (g) | Saturated Fat (g) | Monounsaturated Fat (g) | Polyunsaturated Fat (g) | Protein (g) | Sodium (mg) | |
| Constant | 1.276e+04*** (3,038) |
2,029*** (392.3) |
108*** (24.71) |
801.2** (198) |
362.1 (157.6) |
138.4 (49.35) |
96.44 (57.33) |
95.42 (56.86) |
374.6*** (77.32) |
2.44e+04 (8,565) |
| MPC SNAP | 24.34*** (5.839) |
2.987** (0.7602) |
0.07282 (0.03859) |
1.768*** (0.3972) |
1.042** (0.2847) |
0.3525*** (0.08636) |
0.3963** (0.1072) |
0.2087 (0.08916) |
0.7429** (0.1907) |
42.29 (20.02) |
| Income | 4.628** (1.27) |
0.4658 (0.1652) |
0.03315*** (0.007413) |
0.2106 (0.1128) |
0.2464** (0.06745) |
0.05685 (0.03283) |
0.09951*** (0.02204) |
0.07378*** (0.01719) |
0.1354*** (0.02941) |
3.874 (4.445) |
| Income2 | -0.000215 (0.0002008) |
-1.913e-05 (2.566e-05) |
-1.854e-06 (9.668e-07) |
-4.11e-06 (1.922e-05) |
-1.111e-05 (1.035e-05) |
-1.171e-07 (6.332e-06) |
-5.512e-06 (2.516e-06) |
-4.63e-06* (1.445e-06) |
-8.64e-06 (3.407e-06) |
-0.000113 (0.0005814) |
| School Breakfast | -5,902*** (1,225) |
-705.9*** (166.9) |
-46.68*** (8.979) |
-285.8* (91.01) |
-257.1*** (58.22) |
-75.28*** (17.56) |
-89.99*** (21.07) |
-74.58** (19.3) |
-189.6*** (36.86) |
-2.118e+04*** (4,329) |
| WIC | -536.2 (1,603) |
-91.36 (207) |
-4.801 (10.97) |
-18.19 (106) |
-19.52 (83.66) |
-8.426 (23) |
-3.673 (31.43) |
-8.493 (28.52) |
5.222 (47.15) |
-171.5 (4,898) |
| Female Head | 3,137 (1,384) |
359.9 (182.2) |
18.91 (10.46) |
217.5 (99.02) |
198.6 (71.64) |
44.36 (21.32) |
80.67* (26.15) |
66.29 (24.6) |
20.09 (48.24) |
6,399 (5,205) |
| Black | -4,040 (1,714) |
-573.7 (235.2) |
-34.09* (10.95) |
-316.1 (140.9) |
-134.3 (83.44) |
-93.02** (24.33) |
-33.33 (31.35) |
5.685 (26.95) |
-154.8* (48.09) |
-8,053 (5,917) |
| Hispanic | -3,252 (1,365) |
-376.1 (186.9) |
-6.856 (10.21) |
-277.1 (97.62) |
-158.7 (69.79) |
-71.21** (19.28) |
-57.51 (27.66) |
-17.25 (24.86) |
-87.71 (37.08) |
-7,100 (4,895) |
| Midwest | 4,559 (2,450) |
445.2 (313.5) |
7.784 (21.09) |
363.4 (143) |
206.4 (124.2) |
87.32 (33.5) |
78.26 (44.49) |
19.31 (47.24) |
228.4* (73.51) |
2.476e+04* (7,894) |
| South | 872 (2,074) |
72.3 (266.6) |
-3.605 (18.74) |
178.5 (120.8) |
36.01 (106.9) |
17.15 (27.84) |
19.61 (36.99) |
-4.94 (42.9) |
47.18 (53.34) |
1.125e+04 (5,982) |
| West | -1,040 (2,193) |
-260 (282.7) |
0.5969 (19.86) |
-32.25 (129.3) |
-14.23 (113.1) |
17.99 (30.24) |
-9.246 (38.94) |
-24.03 (44.86) |
24.24 (55.57) |
1,468 (5,282) |
| Guest Meals | 2,350 (856.5) |
318.9 (121.9) |
13.81 (5.736) |
180.3 (73.16) |
101.2 (39.52) |
31.36 (11.58) |
39.79 (15.18) |
23.54 (12.18) |
46.32 (23.89) |
8,163 (5,181) |
| Non-Metro | 4,889 (2,510) |
473.5 (335.5) |
6.308 (14.93) |
322.9 (205.7) |
252.9 (125.2) |
110.9 (40.02) |
73.16 (45.75) |
45.51 (38.57) |
190.6 (101.3) |
2,058 (7,482) |
| Appendix 6: Micronutrient Regression Results for Restriction 2 (SNAP Households & Non-Eligible Households <185% of Poverty Guideline) | ||||||||||||
|---|---|---|---|---|---|---|---|---|---|---|---|---|
| Cholesterol (mg) | Vitamin A (mcg) | Vitamin B¬6 (mg) | Vitamin B12 (mcg) | Vitamin C (mg) | Iron (mg) | Thiamin (mg) | Riboflavin (mg) | Calcium (mg) | Phosphorus (mg) | Magnesium (mg) | ||
| Constant | 941.4 (357) |
3,044* (967.1) |
11.81*** (2.474) |
27.14* (8.058) |
374.8* (110.8) |
95.87** (24.78) |
10.86*** (2.426) |
9.964*** (2.154) |
4,976*** (1,106) |
7,326*** (1,495) |
1,992*** (361.3) |
|
| MPC SNAP | 3.02** (0.8607) |
7.146 (2.478) |
0.01525 (0.005365) |
0.07414* (0.02319) |
0.5122 (0.1933) |
0.1274 (0.04646) |
0.01245 (0.004662) |
0.01898** (0.005313) |
10.29** (2.775) |
13.26** (3.586) |
2.088* (0.6349) |
|
| Income | 0.563* (0.1667) |
1.83** (0.465) |
0.003982*** (0.0009116) |
0.01147* (0.003414) |
0.2161*** (0.04384) |
0.03792*** (0.008994) |
0.003613*** (0.0007744) |
0.004591*** (0.0008617) |
2.198*** (0.4554) |
2.64*** (0.5944) |
0.6096*** (0.1196) |
|
| Income2 | -2.996e-05 (2.264e-05) |
-9.252e-05 (6.401e-05) |
-2.553e-07 (8.772e-08) |
-7.616e-07 (3.076e-07) |
-1.16e-05 (5.403e-06) |
-2.029e-06 (1.01e-06) |
-2.508e-07** (6.448e-08) |
-2.701e-07 (9.696e-08) |
-0.0001209 (5.85e-05) |
-0.0001441 (8.329e-05) |
-3.378e-05 (1.367e-05) |
|
| School Breakfast | -758.5*** (147.1) |
-1,767*** (377.2) |
-4.154** (1.182) |
-11.67 (3.996) |
-213.9*** (48.33) |
-37.84** (10.37) |
-3.539* (1.017) |
-3.967** (1.004) |
-2,475*** (509.2) |
-3,558*** (663.9) |
-832.2*** (141.1) |
|
| WIC | -156.8 (177.3) |
-0.9816 (498.8) |
0.3524 (1.48) |
0.3203 (4.563) |
99.25 (62.94) |
22.77 (14.4) |
0.9247 (1.324) |
2.063 (1.384) |
898.2 (679.1) |
403 (874.8) |
-191.1 (165.9) |
|
| Female Head | 5.106 (216.9) |
508.8 (597) |
0.00894 (1.562) |
-0.6754 (5.756) |
-2.797 (60.36) |
8.834 (12.59) |
0.9409 (1.28) |
1.267 (1.195) |
901.5 (613.8) |
916.3 (793) |
157 (173.2) |
|
| Black | -332.5 (224.5) |
-1,936* (631.3) |
-3.85 (1.525) |
-13.74 (5.539) |
-42.93 (73.47) |
-25.37 (13.18) |
-3.131 (1.302) |
-5.782*** (1.277) |
-3,447*** (659.6) |
-3,968*** (845.5) |
-790.4*** (188.2) |
|
| Hispanic | 212.4 (198.5) |
-1,529** (418.4) |
-0.8997 (1.382) |
-8.945 (4.094) |
165.8 (67.92) |
-9.46 (13.32) |
-1.047 (1.243) |
-2.198 (1.186) |
-1,435 (555.5) |
-1,623 (709.8) |
-334.9 (157.1) |
|
| Midwest | 912.4* (287.2) |
2,389* (783.8) |
5.387 (2.128) |
23.9* (7.348) |
96.53 (85.68) |
31.12 (20.47) |
3.233 (2.123) |
5.49* (1.785) |
3,163* (963.4) |
4,051* (1,303) |
301.9 (315) |
|
| South | 383.3 (214.9) |
661.1 (566.2) |
1.313 (1.671) |
7.334 (5.371) |
-14.01 (73.39) |
6.915 (17.35) |
0.437 (1.72) |
1.652 (1.378) |
527 (698.1) |
948.5 (1,003) |
-148.6 (272.2) |
|
| West | 74.23 (235.2) |
1,296 (633.1) |
2.847 (1.974) |
10.79 (5.602) |
33.09 (81.01) |
8.835 (19.82) |
-0.2936 (1.888) |
2.022 (1.576) |
1,336 (801.9) |
741.9 (1,081) |
-46.79 (290.2) |
|
| Guest Meals | 246.2 (95.57) |
386.4 (216.7) |
0.9547 (0.6286) |
1.517 (1.79) |
78.99 (31.48) |
11.14 (5.837) |
1.237 (0.5911) |
1.188 (0.5979) |
780.6 (330.7) |
1,022 (437.9) |
155.4 (84.42) |
|
| Non-Metro | 858.8 (425.5) |
1,851 (872.5) |
4.608 (2.67) |
21.29 (9.314) |
35.78 (91.83) |
27.22 (19.94) |
3.901 (2.513) |
5.892 (2.167) |
3,084 (1,112) |
3,403 (1,451) |
467.6 (281.1) |
|
| Appendix 7: Recommended Daily Allowance for Adult Males and Females & MPC Estimates from Restriction Three as Percentage of RDA | ||||
|---|---|---|---|---|
| RDA Male | RDA Female | MPC as % RDA Male | MPC as % RDA Female | |
| Energy (kCal) | 2400 | 2000 | 1.01% | 1.22% |
| Carbs (g) | 130 | 130 | 2.30% | 2.30% |
| Dietary Fiber (g) | 34 | 28 | 0.21% | 0.26% |
| Total Sugar (g) | 60 | 50 | 2.95% | 3.54% |
| Total Fat (g) | 90 | 78 | 1.16% | 1.34% |
| Saturated Fat (g) | 25 | 22 | 1.41% | 1.60% |
| Monounsaturated Fat (g) | 32.5 | 28 | 1.22% | 1.42% |
| Polyunsaturated Fat (g) | 32.5 | 28 | 0.64% | 0.75% |
| Protein (g) | 56.0 | 46 | 1.33% | 1.62% |
| Cholesterol (mg) | 300 | 300 | 1.01% | 1.01% |
| Sodium (mg) | 2300 | 2300 | 1.84% | 1.84% |
| Vitamin A (mcg) | 900 | 700 | 0.79% | 1.02% |
| Vitamin B6 (mg) | 1.3 | 1.3 | 1.17% | 1.17% |
| Vitamin B12 (mcg) | 2.4 | 2.4 | 3.09% | 3.09% |
| Vitamin C (mg) | 90 | 75 | 0.57% | 0.68% |
| Iron (mg) | 8 | 18 | 1.59% | 0.71% |
| Thiamin (mg) | 1.2 | 1.1 | 1.04% | 1.14% |
| Riboflavin (mg) | 1.3 | 1.1 | 1.46% | 1.73% |
| Calcium (mg) | 1000 | 1000 | 1.03% | 1.03% |
| Phosphorus (mg) | 700 | 700 | 1.89% | 1.89% |
| Magnesium (mg) | 400 | 310 | 0.52% | 0.67% |
| Phosphorus (mg) | 2400 | 2000 | 1.01% | 1.22% |
| Magnesium (mg) | 130 | 130 | 2.30% | 2.30% |
-
Data may be obtained from the USDA FoodAPS Page, all code for replication published at: https://github.com/ayush-kumar-1/thesis. ↩︎
-
The USDA provides a short history of food assistance programs in the United States, including the Food Stamps Program and SNAP: https://www.fns.usda.gov/snap/short-history-snap#2008%20participation ↩︎
-
Obesity data is collected by the Center for Disease Control (CDC) in the National Health and Nutrition Examination Survey (NHANES). https://www.cdc.gov/obesity/data/adult.html ↩︎
-
All codes for replication of analysis available at https://github.com/ayush-kumar-1/thesis. ↩︎
-
Documentation and data download for FoodAPS available at https://www.ers.usda.gov/data-products/foodaps-national-household-food-acquisition-and-purchase-survey/documentation ↩︎
-
RDA and other dietary guidelines from the USDA available at https://www.dietaryguidelines.gov/sites/default/files/2020-12/Dietary_Guidelines_for_Americans_2020-2025.pdf ↩︎